Introducing the Sea Level Rise - Coastal Inundation Scenarios Tool
Cal-Adapt has released a new tool: Sea Level Rise - Coastal Inundation Scenarios (SLR-CIS). The Sea Level Rise - Coastal Inundation Scenarios tool explores projected water levels associated with Sea Level Rise (SLR) and a near 100-year storm scenario along the California coast and San Francisco Bay from two different models - CalFloD3D-TFS and CoSMoS. This tool was developed to:
- Help users identify what Fourth Assessment SLR datasets are available in their region,
- Enhance understanding of where the different models agree and where they show varying results, based on factors including spatial resolution and modeling approaches,
- Improve access to the underlying models that go into the data visualization so users can easily find and download the highest resolution data available for their own needs.
Global models indicate that California will see substantial sea level rise during this century. The exact magnitude of the SLR depends on factors including global emissions, the rate at which oceans absorb heat, melting rates and movement of land-based ice sheets, and local coastal land subsidence or uplift. This tool presents a subset of data from two of the several SLR models available for California - which were (partially) funded by California’s Fourth Climate Change Assessment. These models (CalFloD3D-TFS and CoSMoS) include SLR and storm inundation modeling. With the inclusion of time and physical processes these dynamic models give more realistic inundation simulations than static models would (e.g. bathtub and pathway models).
The CoSMoS model provides flooding products at 2 meter spatial resolution under different return-interval storms combined with incremental SLR scenarios from 0–3 meter (0–9.8 foot) (Barnard et al., 2019). The CalFloD3D-TFS model assesses potential coastal flooding exposure to areas of interest to the Transportation Fuel Sector (TFS) over five 20-year planning horizons and the Fourth Assessment scenarios using a 3Di hydrodynamic model during extremely high sea level events (72-hour storm event). In addition, the CalFloD3D-TFS includes outputs with two different spatial resolutions for different regions of the state. The inundation scenarios from the 50 meter resolution CalFloD3D-TFS model are available for the entire California coastline and San Francisco Bay. The 5 meter resolution CalFloD3D-TFS model that uses more detailed topography, bathymetry, and building footprints is available for some areas along the coastline. Details are described in Radke et al., 2018.
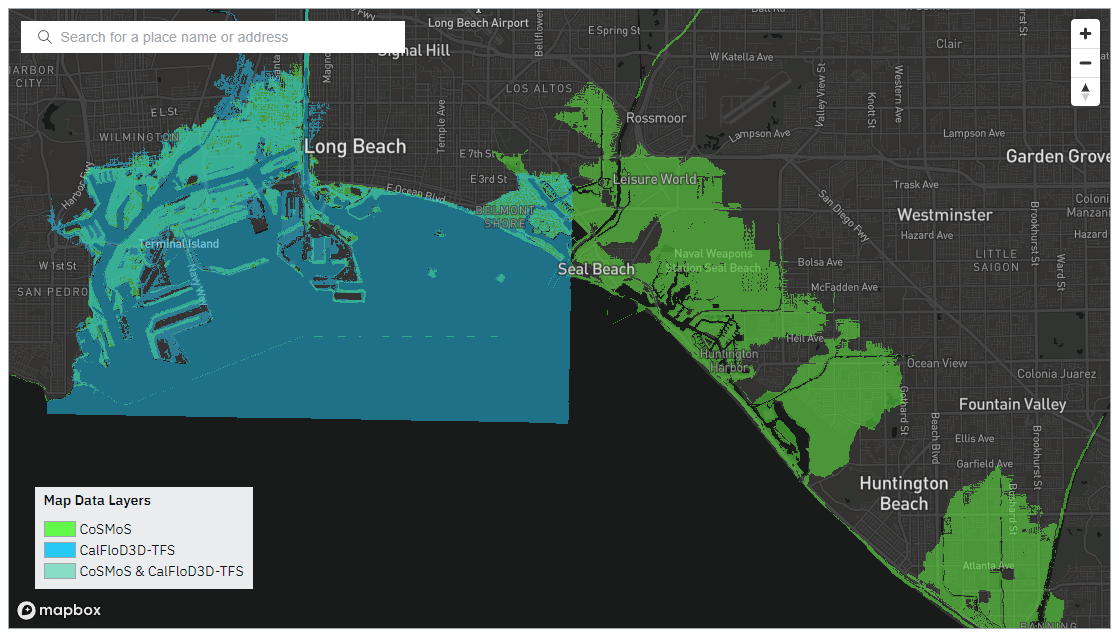
For this tool, the CoSMoS flooding datasets for the 100-year-return interval and incremental SLR scenarios were cross-walked with the CalFloD3D-TFS datasets for two planning horizons (2020-2040 and 2080-2100) based on maximum water level at the corresponding tide gauge locations during flood events. This crosswalk allowed the model results to represent similar scenarios that could be displayed within a single map viewer as shown below. The map viewer shows data coverage extents for the two models at the state and county level resolutions, and presents the available coastal inundation datasets as the user zooms in on the map. The map viewer was also designed to emphasize the overlap areas between the different models to showcase where there is agreement despite the different modeling approaches.
How to use the tool
You can visually compare the results from these two models using the provided map viewer. It includes the ability to pan and zoom as well as search the map using an address or place name. If you zoom out far enough the outlines of the data will draw instead of the data itself so that you have an idea where there is data coverage.
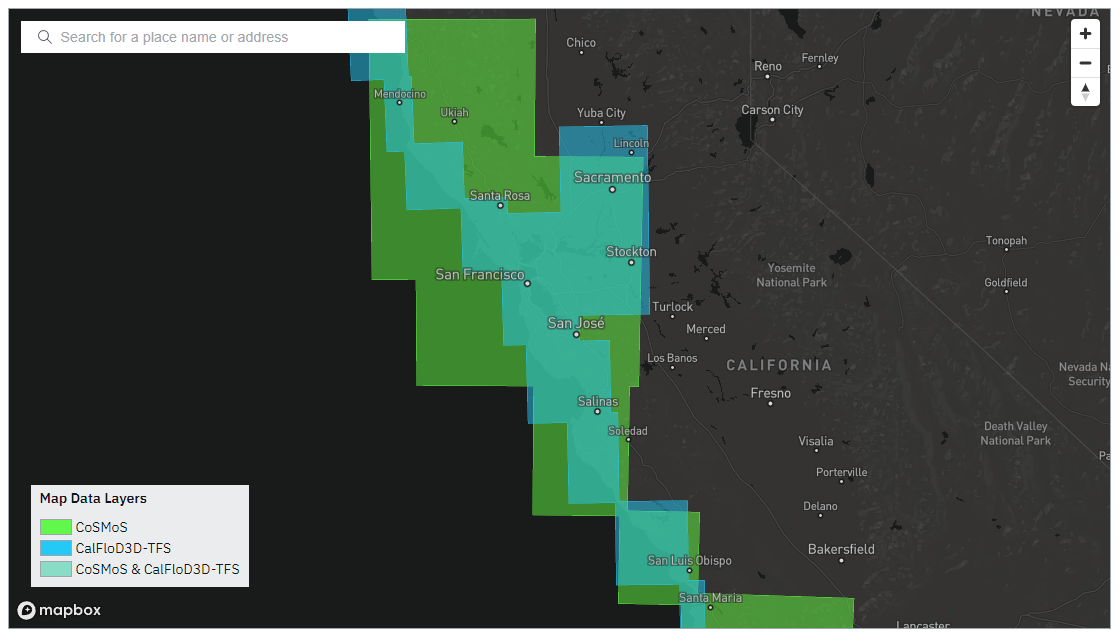
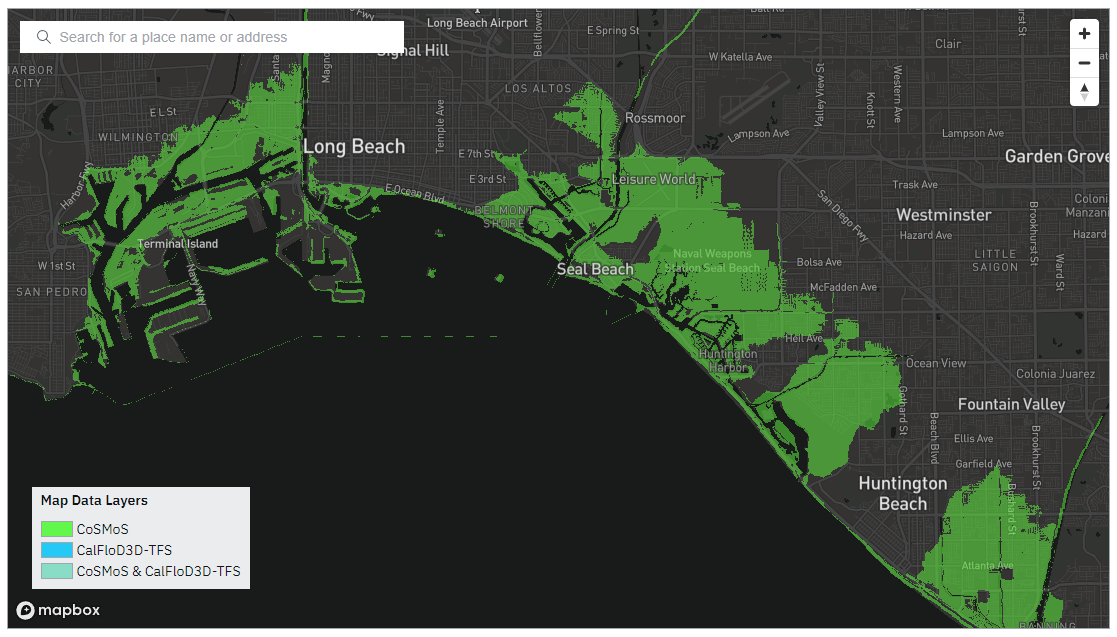
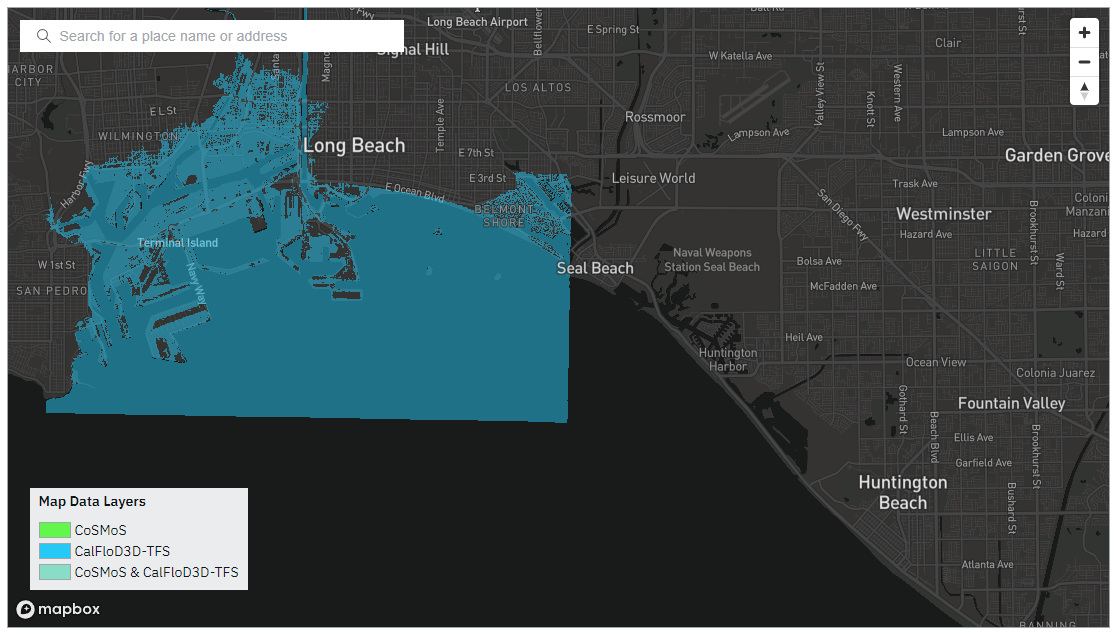
The three map layers (CalFloD3D-TFS 50m, CalFloD3D-TFS 5m, and CoSMoS) can be turned off and on so that you can compare the various different data sources. When there is overlap between CalFloD3D-TFS data and CoSMoS data the color shading of the raster will change to an intermediate color between the blue of CalFloD3D-TFS and the green of CoSMoS.
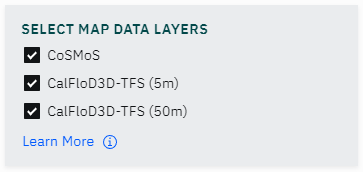
You can toggle the map layers on and off to view them on their own and see the inundation levels of the individual layers.
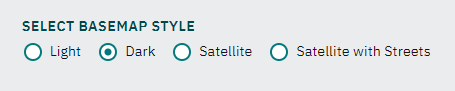
You can change the style of basemap drawn underneath the flood imagery to best suit your needs. By default we use a dark styled basemap as we feel that gives the data the most contrast.
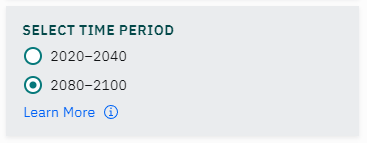
You can also choose from two 20 year planning horizons for near-term (2020-2040) and long-term (2080-2100) exposure assessments.
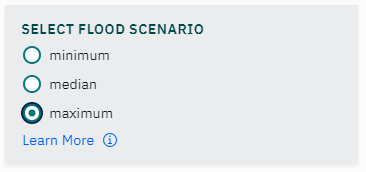
Additionally, you can choose between different flood scenarios (minimum, median, and maximum) that represent the potential range of coastal inundation that may be experienced.
And lastly, at the bottom of the tool, there are links for other tools and additional resources. We invite you to learn more about SLR science by exploring the State of California Sea-Level Rise Guidance from the California Ocean Protection Council on how to incorporate sea level rise into risk assessment and planning. Another helpful resource can be found at Sea the Future, which provides information on the features and functionality of multiple different sea level rise visualization tools that are available for California. Additional details on CoSMoS, including the full set of model outputs and data visualizations from flooding and erosion are available at Our Coast Our Future.
We welcome your feedback!
We hope that the new Sea Level Rise - Coastal Inundation Scenarios tool will help you to understand what Fourth Assessment SLR datasets are available for your area! This tool is being released as a beta version and we are actively seeking user feedback. Please email us at support@cal-adapt.org with your comments and questions.