Climate simulations and scenarios produced for California's Fourth Climate Change Assessment enable investigation of extreme, highly damaging climate changes that are possible but unlikely. One of these low probability, high consequence events is extreme drought. To explore extreme drought in a warmer future, two 20-year drought scenarios were produced from the LOCA downscaled meteorological and hydrological simulations (Pierce et al, 2018):
- The first scenario covers the later part of this century from 2051-2070 and was derived from LOCA downscaled HadGEM2-ES RCP 8.5 simulation
- The second scenario covers the earlier part of this century from 2023-2042. The precipitation during this scenario is daily LOCA downscaled precipitation in the sequence that it occurred from 2051-2070. However, the maximum and minimum temperatures are an adjusted version of 2051-2070 scenario that takes into account climate warming over the century.
A more detailed description about the drought scenarios is available in the technical Report on Climate, Drought, and Sea Level Rise Scenarios prepared for California's Fourth Climate Change Assessment.
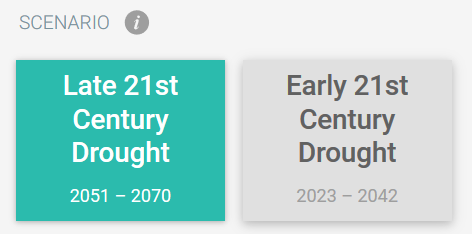
Users can explore data for the two different extended drought scenarios by selecting a Scenario option in the Tool Settings panel.
Explore projections for Temperature and Precipitation
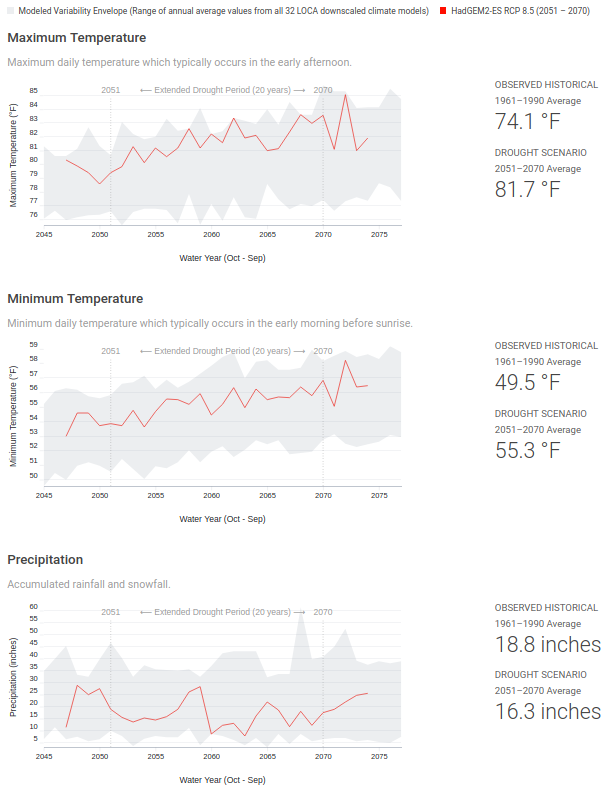
By default, data is shown for Maximum Temperature, Minimum Temperature and Precipitation for the selected Extended Drought period. Each chart shows annual averages (represented by a red line) for the HadGEM2-ES RCP 8.5 drought simulation delineating the period from 5 years prior to 5 years after the 20 year drought. Also shown in the chart is the spread of values (gray envelope) for the climate variable from all the other 32 LOCA downscaled models for the RCP 8.5 scenario. Statistics next to the chart compare the observed historical average with the averages during the 20 year extended drought period.
Data can be aggregated to produce annual averages by water year (October to September) or by calendar year (Jan to Dec).
Additional hydrological variables
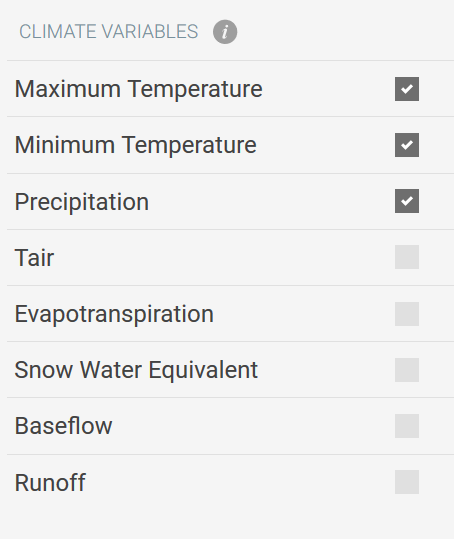
For both drought scenarios, additional downscaled hydrological variables calculated using VIC are also available for exploring the substantially diminished snowpack, runoff, baseflow, etc. during the multi-year dry spell. Users can select one or more hydrological variables to load by clicking on an option.
Explore
Explore the Extended Drought Scenarios tool. Please send us your feedback on the new Extended Drought Scenarios tool at support@cal-adapt.org.