Representing Compound Events on Cal-Adapt
What happens when two (or more!) climate hazards occur at the same time? Nothing good. Many of the most impactful extreme climate events occur in a confluence of multiple individual discrete hazards or weather events. Such events are referred to as compound events or cascading events, and include things like coastal flooding, wildfire, drought and landslides. They are described as high consequence, low probability events as these events occur in concert or sequentially less often than individual extreme climate events, but when they do happen in concert or sequentially, they tend to have major impacts on people and the environment.
Scientists, as is their confusing way, use the terms compound and cascading climate events somewhat interchangeably. To make things a bit easier to understand we are adopting simplified definitions for each of these terms:
Concurrent or Compound Climate Events – occur when two or more weather events occur simultaneously, leading to a disproportionately larger societal impact.
Successive or Cascading Climate Events – occur when two or more weather events occur in succession of each other, either building societal impacts over time or potentially leading to a future extreme event.
Both compound and cascading events depend critically on multiple aspects of the climate system but vary in terms of when the effects are felt.
Challenges in Representing Compound Events
Californians are well acquainted with compound events: wildfire, landslides, drought and coastal flooding. Some compound or cascade events have common underlying hazards associated with them, like wildfire and drought. However, they manifest over different timescales, with wildfires being immediate, discrete events and drought building over long periods of time.
Risk from compound events is harder to assess, compared to single factor events like a heat wave. Here are a few reasons why:
Well understood statistics and simple metrics like mean and standard deviation don’t provide much insight into compound events. Compound events are, by definition, dependent on multiple variables, breaking the traditional statistical rule of independence - increasing the complexity of analysis to represent and understand these events.
Rare events like compound events are difficult to characterize in risk assessments and vulnerability studies so are often not included by decision-makers. Resilience planning for these high-risk, low-frequency events requires a new way of thinking.
Compound events often impact multiple sectors of society and the economy, necessitating coordinated responses from multiple entities that may not have historically worked together.
Both compound and cascading events require climate models to make an accurate prediction of future weather events and get the timing and location of weather events correct. Much work has gone into showing that the mean values of climate models are very good, but models’ ability to predict the right timing and place of weather events is less certain.
Projecting future climate is hard, predicting how people will respond to climate is harder. Not considered here, but of high importance, is how societal disruptions from climate change will cascade – discrete disruptions and vulnerabilities, followed by additional climate stress can be a cascading event. (An example of this might be drought and extreme heat leading to fires damaging or destroying a community, leading to residents in temporary housing being exposed to subsequent climate induced events like smoke, landslides, intense precipitation or extreme heat). Individual climate or weather events can have outsized impacts following earlier, unrelated high-impact events. Collectively this is referred to as cascading disasters – a very important topic, but not the focus of this blogpost.
Visualizing Compound Events on Cal-Adapt
Having enumerated the long list of challenges to understanding compound events, here we describe the first efforts to visualize compound event risks on Cal-Adapt. We start with two compound or cascading events that are increasingly common in California: drought and wildfire. Both indices include a lag component, where the index is informed by the weather of the days preceding it. This is a new advance for Cal-Adapt, which allows for full consideration of the temporal evolution of a compound event.
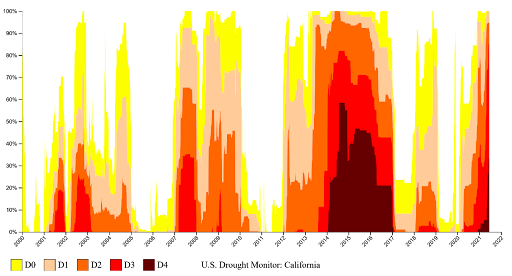
Drought
Defining drought is challenging, as drought means different things to different people - depending on what their concerns are. An ecologist, farmer, water resources planner, well driller, suburbanite and city resident each have different ways of looking at drought.
Drought in California can build and persist for varying lengths of time, each with different societal impacts. Meteorological droughts occur on short timescales (a couple of months) in response to transient factors: low humidity, high temperatures, high wind, and low cloud cover during periods of reduced precipitation. Agricultural droughts occur over a few seasons, resulting in persistent soil water deficiencies, manifesting in plant stress, reduced crop yield and biomass and impacts to ecosystems. Hydrological droughts take many months to years to build, resulting in reduced streamflow, lower reservoir/lake levels with major impacts to wetlands (i.e. California’s delta and coastal sloughs), and reduction in groundwater table level. Multi-decadal droughts, sometimes referred to as “mega-droughts” can occur over many years, leading to ecological regime shifts, reduction in groundwater, major changes in lake, stream function and structure. California is currently in a multi-decadal drought, with climate change making such events more likely.
Drought in California comes in many shapes and sizes. Depending on the societal or environmental impact, people try to quantify drought according to several characteristics. Some common characteristics of drought include duration (how long a drought has been occurring), magnitude (accumulated water deficit), intensity (magnitude relative to duration), severity (how impactful the drought has been), spatial extent (area impacted by drought) or frequency (how often are droughts occurring). How you measure and describe a drought is often a function of what attribute you are trying to show.
Characterizing drought in a simple way that Cal-Adapt users find accessible is a challenge given the many dimensions of drought. One approach is to use a drought metric, a simplified index that combines information from many individual climate variables. Zargar et al. (2011) found almost 150 indices to describe drought – now 10+ years later there are likely more! After a deep dive into drought indices, we settled on the Standardized Precipitation-Evapotranspiration Index (SPEI) as a good compromise. It includes the impacts of increasing temperature on soil moisture loss, a critically important mechanism for driving future droughts in California due to warming. For our purposes, we lean into California’s Mediterranean climate, and calculated drought on the timescale of 9 months to fully encapsulate any given rainy season. A length of 9 months falls in between agricultural and hydrological drought, on the sliding scale of drought timescales.
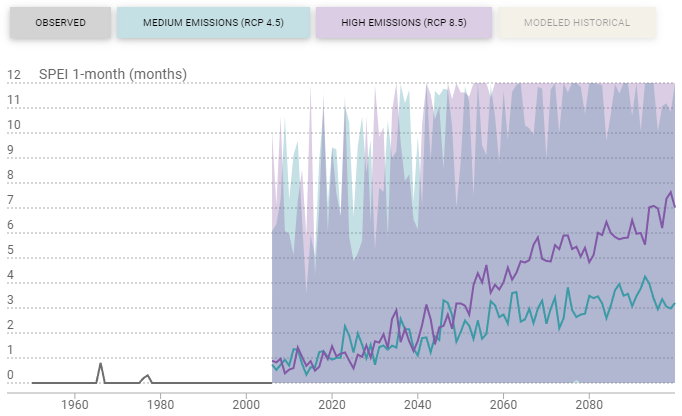
SPEI
The standardized precipitation-evaporation index (SPEI) depicts the combined impacts of precipitation deficits and potential evapotranspiration on soil moisture. SPEI does not include impacts from effects like wind speed, relative humidity or solar radiation impacts (typically short-term forcing) – making it more reflective of long-term hydrological and ecological drought conditions. Here we present SPEI calculated for a 9-month period, attempting to reflect a length slightly longer than California’s typical wet period.
What does SPEI mean? SPEI is standardized, meaning the average value of the index at any location is very close to zero, and values typically range between -2 and 2; with values outside of this range being very rare and suggestive of extreme events (~ 5% of all times). Negative values suggest drought conditions, and positive values suggest wet conditions.
What to look for in SPEI? A value less than -1 implies the drought is at least moderate in intensity, with more negative values representing more severe droughts. On Cal-Adapt we define drought as any 9 month period for which the SPEI is -1 or lower. It is not uncommon for multi-year droughts to have short periods of rainfall, which could show up as a brief period of positive values, but do not erase drought conditions on the ground. If you are interested in longer term droughts, brief wet episodes should not be considered ends to drought conditions.
What doesn’t SPEI tell us? California’s annual and long term water supplies are dependent on snowpack. Rapid onset droughts, or a very hot spring can cause rapid snowmelt – decreasing water availability for a year. This is not reflected in SPEI. Cal-Adapt’s selection of a 9 month lag of SPEI, means short term “flash” droughts are not reflected in the index. A late fall/early winter flash drought could extend fire weather season and stress ecosystems, but could be missed by this version of SPEI.
If the version of SPEI on Cal-Adapt doesn’t meet your needs, or you prefer a different drought index, please let us know.
Wildfire
Cal-Adapt has lots of great information on wildfire, so why create a new index? Work done for California’s Fourth Climate Assessment included rigorous and detailed simulations of wildfire conditions, but were so numerous and large that including them in Cal-Adapt was impractical. Summaries in the form of decadal probabilities of wildfire and hectares burned per year were produced and used for tools on Cal-Adapt. However, for decision-making and planning purposes, these summaries were found to be non-actionable. Here we provide estimates of fire weather risk through calculation of the Keetch-Byram Drought Index (KBDI), from which we are able to estimate the number of days per year of extreme fire risk across California.
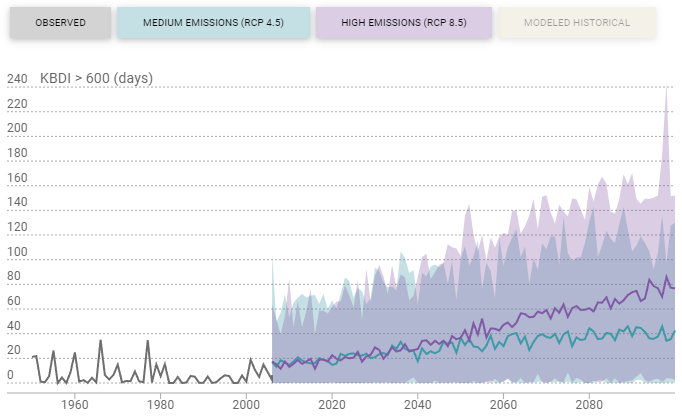
KBDI
The Keetch-Byram Drought Index (KBDI) provides an estimate for the dryness of soil and vegetative detritus. KBDI is cumulative with drought values increasing on dry and warm days, and decreasing during rainy periods – meaning in California we would expect KBDI to increase from the end of the wet season (spring) into the dry season (summer & fall). Fire danger is complex (impacted by human activity, vegetation, wind, temperature, relative humidity, atmospheric stability, etc.) and KBDI represents a simplified proxy for favorability of occurrence and spread of wildfire but is not itself a predictor of fire. The table below explains what values of KBDI represent:
| KBDI | Wildfire risk proxy |
|---|---|
| 0 – 200 | Soil moisture and fuel moistures are high - low wildfire risk. |
| 200 – 400 | Soil and fuels start to dry - average wildfire risk. |
| 400 – 600 | Onset of drought - moderate to serious wildfire risk. |
| 600 – 800 | Severe drought - extreme wildfire risk and increased wildfire occurrence. |
What does KBDI mean? Practically speaking it tells us nothing about wildfire predictions, it just notes the degree to which if a fire was initiated how susceptible is the environment to fire growth and propagation. Wildfire behavior is too complex to model with a simple index, as it depends both on human and natural factors. However, examining how at a given location or region, the degree to which burning is possible is helpful for understanding changes in risk and exposure to wildfire.
If you want to get technical, KBDI attempts to estimate how much precipitation is needed to bring soil back to its max capacity to hold water. But, since this capacity is a function of soil type, amongst other things, it is location specific – and not calibrated to California’s (highly varied) soil. Better to just think of KBDI as a rough measure of water deficits in the ground and vegetation on the ground.
What to look for in KBDI? Bigger values indicate larger soil moisture deficiencies, and a greater potential for wildfires to persist and spread. You can look for both the number of days above a given threshold (say 600), and when in the year these days are occurring. Many locations will see an increase in the number of days with dry conditions, but perhaps more critically these dry days may occur earlier in the spring and later into the fall. Both are critical to understand for decision-makers thinking about a community’s vulnerability to fire and resilience capacity.
What doesn’t KBDI tell us? A lot. It is not a prediction of wildfire occurrence or spread. KBDI knows nothing about the vegetation on the ground, or fuels for a fire. It might, for example, suggest that the Mojave Desert is ripe to burn. It does not know, per-se, if a Diablo wind is present, or if it is a calm day. Again, treat KBDI as a rough estimate and look at the aggregate (across seasons, months or years) rather than at individual days.
The Future of Conveying Risk from Compound Events
We’re excited about the progress we’ve made by making these indices available via the Cal-Adapt Data Download Tool, API, and through the Local Climate Snapshot Tool. Future efforts, depending on funding, could include additional metrics and indices, spatial representation of concurrent or cascading climate events, or utilizing approaches from the social science discipline referred to as decision-making under deep uncertainty.